
Air Sampling Verses Dispersion Modeling During the COVID-19 Pandemic
Bernard L. Fontaine, Jr., CIH, CSP, FAIHA, Contributor
As the American economy recovers and workers return to work, there is concern the air may contain the SARS CoV-2 virus. This is especially of concern if it is found there is no long-term immunity from recovered individuals. People in various industries may work and/or live in close quarters, such as meat processing, canaries, fisheries, onboard military ships and submarines, schools, agricultural settings, etc. or use public transportation.
The SARS CoV-2 virus has a reproductive rater higher than other similar contagions, especially during speaking, suggesting it is a super spreader in the environment. The infectivity rate appears low, as represented by the Ro and K factors, suggesting the vial load for causing infection may be 1,000 log copies or as low as 100 log copies in air.
Preliminary air sample results are mixed, based on study limitations to healthcare and the number of total number of samples collected during the investigation. Compounding this is the fact that there are no established air sampling protocols for viral loads in air. Moreover, the level of risk of respiratory infection has not been determined.
In certain limited workplaces and work practices, air monitoring may be appropriate to evaluate worker exposure and determine the level of risk. The spread of the SARS-CoV-2 virus through the air has become a controversial topic among scientists. Airborne transmission calculators have modeled the dynamics of risk, based on building management system parameters, but there are limitations in the available information and assumptions.
Air sampling methods vary by sample size and cost, while analytical test method for the SARS CoV-2 virus is limited presently to reverse transcriptase polymerase chain reaction (RT-PCR) for precision and accuracy. Reliability and cost remain issues remain elusive on whether or not to perform air monitoring in work areas of concern or use a risk assessment dispersion model. This article attempts to investigate the business value for collecting air samples, in collaboration with modeling, to protect the health of the workforce in specific or nontraditional workplaces.
Monitoring Air in the Indoor Environment
In the working environment, people may be exposed a variety of noxious gases, vapors, dusts, mists and fumes. Besides these potential airborne contaminants, infectious agents like bacteria, viruses, mold spores and fungi can be found in the indoor environment. Some air contaminants may be liberated from a work process or operation, while other indirect exposure may arise as a result of dry sweeping, vacuuming or cleaning contaminated surfaces. Of most concern today is the presence of the SARS CoV-2 novel coronavirus, which is attributed to the generation of aerosols by infected individuals during the COVID-19 pandemic.
Airborne contaminants are inhalable particles suspended in the air that may enter the body when breathed. Most large particles are stopped in the upper respiratory tract (e.g. nose and back of the throat), but smaller respirable particles can reach deep inside the lungs. The mass and particle size will determine how far the aerosolized particle can reach the bronchioles or the terminal alveolar sacs Inhaled contaminants may cause of respiratory issues including tissue damage, tissue reaction, disease, or physical obstruction. New scientific evidence is available on the transmission of SARS-CoV-2 virus which suggests that not only larger droplets cab become airborne but respiratory aerosols can function as potential transmission pathways for COVID-19.
The novel coronavirus may be aerosolized by coughing, singing, shouting, sneezing, playing sports or musical instrument. The airborne concentration is based on the rate of generation and suspension of the respiratory droplets or aerosols in air over a period of time. Large respiratory droplets in the near field are typically greater than 50 µm in size with water and mucous, medium size respiratory droplets are greater than 10 µm and small micro droplet nuclei are less than 5 µm. which can spread to the far field. Respiratory droplets can cause infection when they are inhaled or deposited on mucous membranes in sufficient quantities over time, such as those that line the inside of the nose and mouth, bronchiole passages and alveolar spaces in the deep lung.
As the respiratory droplets travel further from an infected person, the airborne concentration of these droplets decreases. Larger droplets fall out of the air due to gravity. Smaller droplets and particles spread in the air depending on the airflow pattern and amount of building ventilation. With passing time, the amount of infectious virus in respiratory droplets can decrease with fewer people in the room. In most instances, the building ventilation should continue to operate even with nobody in the room and for a period after normal work hours.
Other potential modes of transmission may include medical procedures such as bronchoscopy, tracheotomy, tracheal tube intubation, noninvasive ventilation, and dental procedures. Viral aerosols may become aerosolized by flushing toilets in COVID-19 patient hospital rooms and vacuuming carpets and cleaning other porous surfaces such as bed linen and surgical gowns in healthcare facilities. For example, otolaryngologists and supporting health care workers (HCWs) are particularly at high risk of becoming infected while treating patients as many in-office procedures and surgeries are Aerosol Generating Medical Procedures (AGMP). Based on a review of the literature and various guidelines, engineering and administrative controls help mitigate the risk to health care workers of becoming infected with SARS-CoV-2 while providing clinical care. Without air monitoring in workspaces with high density occupancy or workspaces with a lack of building or room ventilation, workers are at risk of exposure to the virus.
Risk of Airborne Infectious Disease
One approach to quantifying the risk associated with airborne transmission aerosols and respiratory disease has been the Wells-Riley model (Riley et al., 1978). The model is based on the concept of “quantum of infection”, whereby the generation rate of infectious airborne particles (or quanta) can be used to model steady state conditions in a well-mixed and ventilated indoor environment. The model was constructed to evaluate exposure to infectious particles in air and potentially succumbing to infection. In 1997, the original Wells-Riley model was enhanced to consider dynamic or time-varying exposure.
The premise of the Wells-Riley model examined the probability of infection based on assumptions like the number of infected cases, number of susceptible individuals, pulmonary ventilation rate, quanta generation rate, room air ventilation with clean air, and exposure time. The model did not look at the person-to-person variability of those who may be infected but not expressing clinical symptoms or changes in room occupancy density because people move about in different work spaces throughout the day. Finally, the model did not evaluate the size or mass for aerosol dispersion based on source of exposure – coughing, sneezing, speaking etc. and evaporation of moisture, which may affect transmission near- verse far field.
Infectivity of the Working Population
Reproductive rate (Ro) is the average number of infections caused by each person. Ro refers to the “effective reproduction number” and, basically put, it’s a way of measuring an infectious disease’s capacity to spread. The R number signifies the average number of people that one infected person will pass the virus to other people. Importantly, a disease’s Ro value only applies when everyone in a population is completely vulnerable to the disease. This means:
- No one has been vaccinated
- No one has had the disease before, and
- There’s no way to control the spread of the disease
The R number isn’t a fixed value, but it can be affected by a range of factors, including not just how infectious a disease is but how it develops over time, how a population behaves, and if any immunity already possessed from previous infection or vaccination. Location is also important: a densely populated city is likely to have a higher R than a sparsely peopled rural area. Three possibilities exist for the potential transmission or decline of the COVID-19 illness, depending on its Ro value:
- If Ro is less than 1, each existing infection causes less than one new infection. In this case, the disease will decline and eventually die out.
- If Ro equals 1, each existing infection causes one new infection. The disease will stay alive and stable, but there won’t be an outbreak or an epidemic.
- If Ro is more than 1, each existing infection causes more than one new infection. The disease will be transmitted between people, and there may be an outbreak or epidemic
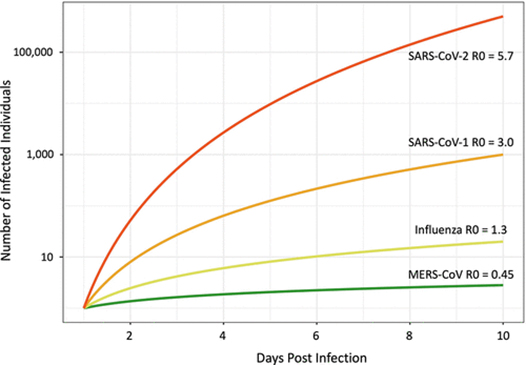
Without using physical or social distancing the Ro rate can range from 2-5 for super spreaders. A study by Shröder (2020) suggests that SARS CoV-2 virus may have a Ro of 5.7, which slightly higher than the SARS CoV-1 virus at 3.0. To assess the risks posed by “super-contamination” events, we have to look at the K factor, as well as the R factor. The dispersion factor, K denotes how even the rate of the spread is between all the different people infecting others. In other words, whether each carrier infects roughly the same quantity of people or if it varies. The lower K is, the newer infections come from a small number of carriers.
Alternatively, the K factor is close to 1 for the seasonal flu, meaning that all carriers infect about the same number of people. Scientists have also established that during the 2002 SARS epidemic, K was 0.16, which is very low – suggesting that “super-spreaders” played a big role in the transmission of the virus. By contrast, scientific estimates for Covid-19’s K factor are very divergent. In a paper awaiting publication, a team of Swiss researchers said that the K factor is much higher for Covid-19 than it was for SARS, so “super-spreaders” are much less of an issue than they were in 2002.
However, a team of researchers from the London School of Hygiene and Tropical Medicine estimated that 80 percent of infections are caused by only 10 percent of carriers. In this model, K is very low, at around 0.1 percent, which would mean that “super-contamination” events can play a critical role as lockdown measures ease. The dispersion factor (k) represents how much a disease cluster. The lower the K number the higher the risk as shown below:
- 1918 Influenza pandemic had a K factor or 1
- MERS had a K factor of 0.25
- SARS CoV-1 had a K factor or 0.16
- SARS CoV-2 has a K factor of 0.1
In short, some scientists believe the infectivity rate may be around 1,000 log copies of the RNA virus to as low as 100 log copies in more suspectable or vulnerable populations or workers.
Air Modeling and Dispersion Studies
Currently there are three air dispersion models created to evaluate SARS CoV-2 in the built environment. These include the Air Transmission Estimator from the University of Colorado, the Airborne Infection Risk Calculator, and the most recent model developed for the US Department of Homeland Security by the National Institute for Science and Technology called the Fate and Transport of Indoor Microbiological Aerosols (FaTIMA).
These models use a variety of contributing factors to determine risk from occupancy density, time, and frequency of exposure to the performance of the ventilation system. While each of these air dispersion models can determine the relative risk within a commercial or residential building, it has limitations for industrial use, especially for large volume areas like warehouses and distribution, factory floors, airplane hangars, and non-traditional work environments. Most important concern are those occupational settings with workers on assembly lines working in close proximity or working in closed quarters such as a submarine or maritime vessel. While these are only a few examples, there are other workplaces and occupations that meet these criteria for conducting air sampling and analysis.
Benefit of Air Sampling High Risk Environments
The Center for Disease Control and Prevention (CDC) states that COVID-19 is thought to spread mainly through close contact from person to person, including between people who are physically near each other (within about 6 feet). People who are infected but do not show symptoms can also spread the virus to others. Scientists are still learning about how the virus spreads and the severity of illness it causes. How easily a virus spreads from person to person can vary. The virus that causes COVID-19 appears to spread more efficiently than influenza but not as efficiently as measles, which is among the most contagious viruses known to affect people.
Tang et. al. (2020) reported that coughing can produce 3,000 droplet nuclei whereas sneezing can produce up to 40,000 droplet nuclei. The authors estimated that the 50 µm droplets have about a 37 percent probability of containing 7 x 10⁶ log copies/ml of the coronavirus from an infected person. Alternatively, the authors reported a 0.37 percent change of infectivity to aerosols around 10µm. The authors highlighted the fact that 1 minute of loud speaking could produce thousands of droplets per second. In essence, on average 1,000 viral droplet nuclei could be liberated by an infected person and remain airborne in 8 minutes within the room. The close proximity of people nearby along with the occupancy density and building ventilation are contributing factors to the level of risk.
Droplet nuclei can be dispersed as large particles with water and mucous with the virus and smaller aerosolized particles may travel further distances. Without proper building ventilation, airflow within the occupied space, and air filtration, people may inhale the virus over time. The more time spent within an interior space with more infected or infectious people may increase the level of risk of exposure. The infectivity rate is unknown but several studies have suggested that a three-log difference may be sufficient over time for low risk as opposed to a seven-log increase which is considered a high risk.
It is important to understand that people may be different levels of infectivity. Some people may carry the virus and not exhibit symptoms while others may express symptoms or have low levels of virus in their body upon recovery. If people recover from the COVID-19 illness or remain in the presence of “super spreaders” for periods of time, workers may become reinfected since their immunity may be limited.
Faridi et. al. (2020) investigated the air of patient rooms with confirmed COVID-19 in the largest hospital in Iran, on March 17, 2020. To collect the SARS-CoV-2 particles, ten air samples were collected into the sterile standard midget impingers containing 20 mL DMEM with 100 μg/mL streptomycin, 100 U/mL penicillin and 1% antifoam reagent for 1 hour. Besides, indoor particle number concentrations, CO2, relative humidity and temperature were recorded throughout the sampling duration. Viral RNA was extracted from samples taken from the impingers and Reverse-Transcription PCR (RT-PCR) was applied to confirm the positivity of collected samples based on the virus genome sequence. Fortunately, in this study all air samples which were collected 2 to 5 meters from the patients’ beds with confirmed COVID-19 were negative. Despite that all air samples were negative; however, the authors suggest further in vivo experiments should be conducted using actual patient cough, sneeze and breath aerosols in order to show the possibility of generation of the airborne size carrier aerosols and the viability fraction of the embedded virus in those carrier aerosols.
Chia et. al. (2020) collected air samples from hospital rooms of COVID-19 patients for SARS-CoV-2 RNA. Environmental sampling is conducted in three airborne infection isolation rooms (AIIRs) in the ICU and 27 AIIRs in the general ward. 245 surface samples are collected. 56.7% of rooms have at least one environmental surface contaminated. Air sampling was performed in three of the 27 AIIRs in the general ward, and detected SARS-CoV-2 PCR-positive particles of sizes >4 µm and 1-4 µm in two rooms, despite these ICU rooms having 12 air changes per hour.
Air samples collected in the hospital room of two COVID-19 patients, one ready for discharge, the other newly admitted, were subjected to RT-qPCR and virus culture. (Lednicki, 2020) The genomes of the SARS-CoV-2 collected from the air and isolated in cell culture were sequenced. The results showed viable SARS-CoV-2 was isolated from air samples collected 2 to 4.8 m away from the patients. The genome sequence of the SARS-CoV-2 strain isolated from the material collected by the air samplers was identical to that isolated from the newly admitted patient. Estimates of viable viral concentrations ranged from 6 to 74 TCID50 units/L of air.
The Razzini (2020) study evaluated the contamination of the air by SARS-CoV-2 RNA in the COVID-19 isolation ward of a hospital in Milan, Italy. Air samples were collected inside five different zones of the ward including contaminated (COVID-19 patients’ area), semi-contaminated (undressing room), and clean areas. SARS-CoV-2 RNA detection was performed using real time reverse transcription polymerase chain reaction. All air samples collected from the contaminated area, namely the intensive care unit and corridor, were positive while viral RNA was not detected in either semi-contaminated or clean areas. The results showed that environmental contamination did not involve clean areas, but the results support the need for strict disinfection, hand hygiene and protective measures for healthcare workers and he need for airborne isolation precautions.
Kenarkoohi et. al. (2020) used a liquid impinger biosampler to take fourteen (14) air samples in different wards of the indoor air of the hospital. The specific primer and probe real-time reverse transcriptase-polymerase chain reaction (RT-PCR) were applied to detect viral genomes of the SARS-CoV-2 virus in positive air samples. Only two positive air samples (in the ICU) out of 14 ones taken from different wards with confirmed COVID-19 patients. The sample results revealed the possibility of airborne transmission of SARS-CoV-2 though more studies are required to determine the role of actual mechanisms such as cough, sneeze, normal breathing and speaking in the emission of airborne size carrier aerosols. Likewise, more quantitative analyses are needed to estimate airborne viability of SARS-CoV-2 in the carrier aerosols.
A multifactorial investigation of a SARS-CoV-2 outbreak was performed in a large meat processing complex in Germany. Infection event timing, spatial, climate and ventilation conditions in the processing plant, sharing of living quarters and transport, and viral genome sequences were analyzed. The sample results suggest that a single index case transmitted SARS-CoV-2 to co-workers over distances of more than 8 meters, within a confined work area in which air is constantly recirculated and cooled.
Viral genome sequencing shows that all cases share a set of mutations representing a novel sub-branch in the SARS-CoV-2 C20 clade. Günther et. al. (2020) identified the same set of mutations in samples collected in the time period between this initial infection cluster and a subsequent outbreak within the same factory, with the largest number of confirmed SARS-CoV-2 cases in a German meat processing facility reported so far. The results indicated climate conditions, fresh air exchange rates, and airflow as factors that can promote efficient spread of SARS-CoV-2 via long distances and provide insights into possible requirements for pandemic mitigation strategies in industrial workplace settings.
Kim et al. (2020) investigated air contamination in the rooms of eight COVID-19 patients in four hospitals. Some patients were in negative-pressure rooms, and others were not. None had undergone aerosol-generating procedures. On days 0, 3, 5, and 7 of hospitalization, air samples were collected 2 meters from the patient and from the anterooms. All 52 air samples were negative for SARS-CoV-2 RNA. Despite widespread surface contamination of SARS-CoV-2 RNA was observed. In total, 89 of 320 (27%) environmental surface samples were positive for SARS-CoV-2 RNA. Surface contamination of SARS-CoV-2 RNA was common in rooms without surface disinfection and in rooms sprayed with disinfectant twice a day. However, SARS-CoV-2 RNA was not detected in a room cleaned with disinfectant wipes on a regular basis. The data suggest that remote (> 2 m) airborne transmission of SARS-CoV-2 from hospitalized COVID-19 patients is uncommon when aerosol-generating procedures were not performed.
Lane et. al. (2020) reported using bioaerosol samples to collect samples in an infected isolation room, bathroom, and anteroom of a ventilated patient with coronavirus disease 2019. Twenty-eight samples were negative for severe acute respiratory syndrome coronavirus 2 (SARS-CoV-2) nucleic acid, possibly due to the patient being on a closed-circuit ventilator or the efficiency of the air exchanges in the room. Infection control and the liberation of bioaerosols in ICUs is limited due to the number of air changes per hour (ACH), airflow within the room, air filtration efficiency, and isolation used to control exposure from the infected patients.
Few studies have explored air and surface contamination by severe acute respiratory syndrome coronavirus 2 (SARS-CoV-2) in healthcare settings. Tan et. al. (2020) collected air and environmental samples from the isolation wards and intensive care units designated for COVID-19 patients. Clinical data and the results of nasopharyngeal specimen and serum antibody testing were also collected for the patient sample. Twelve air and 355 surface swab samples were collected from the patient care areas of 15 patients with mild COVID-19 and nine patients with severe/critical COVID-19. Only one air sample taken during the intubation procedure tested positive. The authors concluded that air and surface contamination with viral RNA was relatively low in these healthcare settings after the enhancement of infection prevention and control. Environmental surface contamination could still be found near seroconverted patients, suggesting the need to maintain constant vigilance in healthcare settings to reduce healthcare-associated infection during the COVID-19 pandemic.
Some more notable higher risk indoor environments may be meeting or conference rooms, call centers, auditoriums, restaurants and bars, movie theaters, bowling alleys, food processing plants (meat process, fisheries, and canneries), nursing homes, hospitals, migrant agricultural workers living and working in close quarters, people using public transportation or share rides, and other similar working environments. Exposure in each of these work environments depends on the latency of the occupancy density within the interior space and timeframe work is being done. While outdoor environments are considerably lower risk due to the wind speed and direction, workers also may become infected working or traveling in close proximity to each other.
Besides these confounding factors, there are concerns associated with air monitoring. Indicators suggesting a need for air monitoring in the workplace may include:
- Frequent or long duration use of a work task or process which generates hazardous work environment,
- Occupancy density within the work space, room, or other occupied space,
- Efficiency of the building ventilation is not known or when no mechanical ventilation is available to dilute the level of airborne contaminants
- People in the workplace complain of COVID-19 concerns that may be due to both frequency and duration of exposure to infected individuals,
- Engineering and/or administrative controls and other standard public health initiatives are inadequate,
- Lack or improper use of adequate personal protective clothing, face covers and respirators
- Non-traditional work environments such as public or commercial transportation
Air Monitoring Methods for Bioaerosols
Although no specific air sampling methods have been published for SARS-CoV-2 that causes COVID-19, scientific professionals can look to previous investigations of corona viruses such as SARS-CoV-1 and the general principles of evaluating biological contaminants. SARS-CoV-1 investigations by Booth et. al. focused on identifying environmental contamination in infected areas and the potential for transmission to adjacent areas. Sampling approaches included swab sampling of surfaces and air sampling followed by Polymerase Chain Reaction (PCR) analysis.
Various sampling devices can be used to recover airborne viruses, and some are illustrated in the Tables below. The most common are liquid and solid impactors, as well as filters are described by Verreault et. al. It should be noted that indoor air sampling for viruses is not a common practice due to the low levels present in those environments.
One of the major issues in indoor bioaerosol research is the lack of standardization in the methodology, of air sampling strategies and sample treatment to the analytical methods applied. The main characteristics to consider in the choice of indoor sampling methods for bioaerosols are the sampler performance, the representativeness of the sampling, and the concordance with the analytical methods to be used. The selection of bioaerosol collection methods is directly dependent on the analytical methods, which are chosen to answer specific questions raised while designing a study for exposure assessment.
Cheng VC et. al. sampled air close to six asymptomatic and symptomatic COVID-19 patients with and without surgical masks was performed with sampling devices using sterile gelatin filters. Frequently touched environmental surfaces near twenty-one (21) patients were swabbed before daily environmental disinfection. The correlation between the viral loads of patients’ clinical samples and environmental samples was analyzed.
The results in this particular case showed all air samples were negative for SARS-CoV-2 RNA in the six patients singly isolated inside airborne infection isolation rooms (AIIRs) with 12 air changes per hour. Of 377 environmental samples near 21 patients, 19 (5.0%) were positive by reverse-transcription polymerase chain reaction (RT-PCR) assay, with a median viral load of 9.2 × 10² copies/mL (range, 1.1 × 10² to 9.4 × 10⁴ copies/mL). The contamination rate was highest on patients’ mobile phones (6 of 77, 7.8%), followed by bed rails (4 of 74, 5.4%) and toilet door handles (4 of 76, 5.3%). We detected a significant correlation between viral load ranges in clinical samples and positivity rate of environmental samples (P < .001). The authors concluded that the SARS-CoV-2 RNA was not detectable by air samplers, which suggests that the airborne route is not the predominant mode of transmission of SARS-CoV-2.
Table 1 – Air Monitoring Methods for SARS CoV-2 Bioaerosols
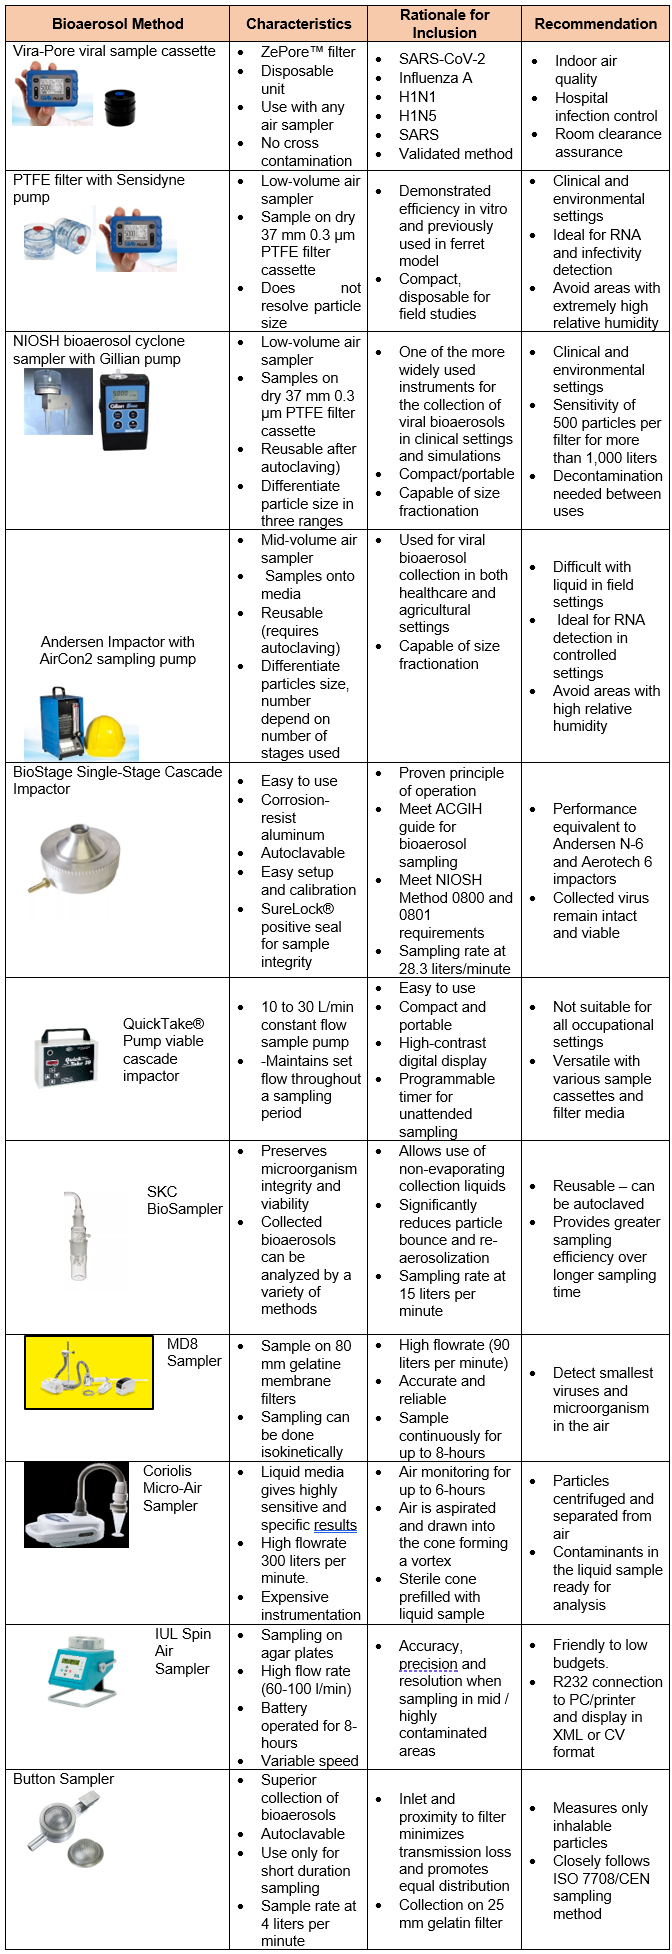
| Button Sampler | · Superior collection of bioaerosols
· Autoclavable · Use only for short duration sampling · Sample rate at 4 liters per minute |
· Inlet and proximity to filter minimizes transmission loss and promotes equal distribution
· Collection on 25 mm gelatin filter |
· Measures only inhalable particles
· Closely follows ISO 7708/CEN sampling method |
For cyclone aerosol collection, the aerosol stream enters the body of the cyclone through the inlet, the air flow follows the curved interior wall and flows in a spiral pattern. If aerosol particles are larger than the cut-off diameter, then the inertia of the particles causes them to collide with the wall of the cyclone and accumulate. After spiraling downward, the air flow comes up through the center of the cyclone and exits through the outlet (called a vortex finder) at the top. The tangential inlet reversed-flow cyclone, which is the most common type of cyclone sampler.
The field industrial hygienist has a variety of tools and methodologies available to conduct an environmental survey (ASTM 2014a; Flannigan et al. 2011; Hung et al. 2005). However, many of these approaches have lacked standardization and made the interpretation and comparison between studies challenging (Flannigan et al. 2011). In 2005, the American Industrial Hygiene Association (AIHA) published the second edition of the Field Guide for the Determination of Biological Contaminants in Environmental Samples (Hung et al. 2005). This reference provides the industrial hygienist access to the most up to date methods to detect and quantify bioaerosols in the environment, and covers methods of how to conduct a survey, sample bioaerosols, and interpret the collected data (Hung et al. 2005).
Similarly, other reference sources have been published by Flannigan et al. (2011) and the American Conference of Governmental Industrial Hygienists (ACGIH) [Macher 1999] that extensively outline available methods to analyze collected bioaerosols as well as strategies to conduct an environmental survey. ASTM International has issued a wide range of standards on indoor air quality, including assessment of fungal growth and collection of bioaerosols and a guide to developing an air sampling strategy (ASTM 2009; ASTM 2014a; ASTM 2014b; ASTM 2014d). The European Committee for Standardization has also published standards on sampling for bioaerosols and related topics (CEN 2000; CEN 2003; CEN 2004). The information provides a very broad overview of the viable and non-viable methods available to detect bioaerosol sources that are described in the references listed above.
Other air sampling methods include a six-stage Andersen cascade impactor, which separate out aerosols by particle side. (Andersen, 1958) Each stage contains a Petri plate (green) filled with nutrient agar (brown). The stages have progressively smaller nozzles, which create higher particle impaction velocities onto the agar. The aerosol particles (red) flow from the top into the first stage, where particles with aerodynamic diameters larger than 7 µm impact the agar. The remaining particles flow to the second stage, where particles with aerodynamic diameters between 7 µm and 4.7 µm are collected, and so on for the rest of the stages.
An air monitoring program will usually last for a day, but can be longer if a variety of work processes need to be re-examined and, depending on the working condition and environment, the nature of the industrial processes, and the laboratory analyses needed to evaluate the risk. Work environments that change intermittently throughout the day must be evaluated to determine if the sampling period reflects the time worked. Some work operations or processes may be too short to collect an adequate air volume. Traditionally, workers should be monitored for their entire workday. Statistically, air sampling should be repeated to evaluate both the work practices and tasks being performed. Otherwise, anecdotal information may or may not be representative of the work environment.
Evaluation of Samplers for SARS CoV-2 Aerosols
Bekking et. al. examined the performance of low and moderate volume bioaerosol samplers for the collection of viral RNA and infectious influenza virus in vitro and in vivo using artificial bioaerosols and the ferret model of influenza virus infection. The following samplers were tested: the polytetrafluoroethylene filter (PTFE filter), the 2‐stage National Institute of Occupational Safety and Health cyclone sampler (NIOSH cyclone sampler) and the 6‐stage viable Andersen impactor (Andersen impactor).
The PTFE filter and NIOSH cyclone sampler collected similar amounts of viral RNA and infectious virus from artificially‐generated aerosols under a range of relative humidity (RH). Using the ferret model, the PTFE filter, NIOSH cyclone sampler and the Andersen impactor collected up to 3.66 log10copies of RNA/L air, 3.84 log10copies of RNA/L air and 6.09 log10copies of RNA/L air respectively at peak recovery. Infectious virus was recovered from the PTFE filter and NIOSH cyclone samplers on the peak day of viral RNA recovery. The authors concluded the PTFE filter and NIOSH cyclone sampler are useful for influenza virus RNA and infectious virus collection and may be considered for clinical and environmental settings.
There is no accepted standard or recommended method to collect and analyze for SAR CoV-2 virus. Rahmani et. al. (2020) reviewed published papers to evaluate the sampling protocols and detection methods of SARS-Cov-2 virus. It was found that SARS CoV-2 was present in some air samples that were collected from patient’s rooms in hospitals. This result warrants its airborne transmission potential. However, due to the fact that in the most reviewed studies, sampling was performed in the patient’s room, it seems difficult to discriminate whether it is airborne or is transmitted through respiratory droplets.
Moreover, some other disrupting factors such as patient distance from the sampler, using protective or oxygen masks by patients, patient activities, coughing and sneezing during sampling time, air movement, building ventilation, sampler type, environmental sampling conditions, storage and transferring conditions, can affect the results. About the sampling methods, most of the used samplers such as PTFE filters, gelatin filers and cyclones showed suitable performance for trapping SARS and MERS-CoV viruses followed by qualitative reverse transcription polymerase chain reaction (RT-PCR) analysis. RT-PCR is one of the most widely used diagnostic tests for detecting pathogens, including viruses.
RT-PCR is the most sensitive technique for mRNA detection and quantitation currently available. Compared to the two other commonly used techniques for quantifying mRNA levels, Northern blot analysis and RNase protection assay, RT-PCR can be used to quantify mRNA levels from much smaller samples. In fact, this technique is sensitive enough to enable quantitation of RNA from a single cell. RT-PCR is now the method of choice for quantitating changes in gene expression. Furthermore, real-time RT-PCR has become the preferred for validating test results. Two strategies are commonly employed to quantify the results obtained by real-time RT-PCR; the standard curve method and the comparative threshold method.
In this method, a standard curve is first constructed from an RNA of known concentration. This curve is then used as a reference standard for extrapolating quantitative information for mRNA targets of unknown concentrations. Though RNA standards can be used, their stability can be a source of variability in the final analyses. Another quantitation approach is termed the comparative Ct method. This involves comparing the Ct values of the samples of interest with a control or calibrator such as a non-treated sample or RNA from normal tissue. The Ct values of both the calibrator and the samples of interest are normalized to an appropriate endogenous housekeeping gene. Real-time PCR requires an instrumentation platform that consists of a thermal cycler, a computer, optics for fluorescence excitation and emission collection, and data acquisition and analysis software.
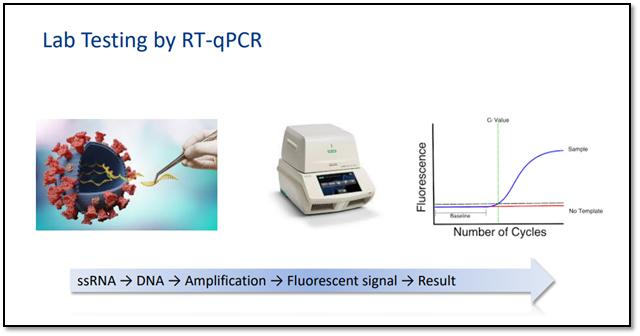
Photo courtesy of Eurofins Laboratories
Most laboratories are qualitatively analyzing air samples for RT-PCR. Quantitative analysis may be on the horizon. Industrial hygienist who are collecting air samples are using a personal air sample pump and the 37 mm 0.3 µm PTFE filter in clear styrene cassettes. A minimum air volume of 1,000 liters at a flow rate of 3-5 liters per minute is needed to meet the limit of analytical detection, which is less than 500 log copies per filter. Most laboratories performing the analysis suggest collecting 3,000 to 4,000 liters of air to improve analytical accuracy and precision of the sample results.
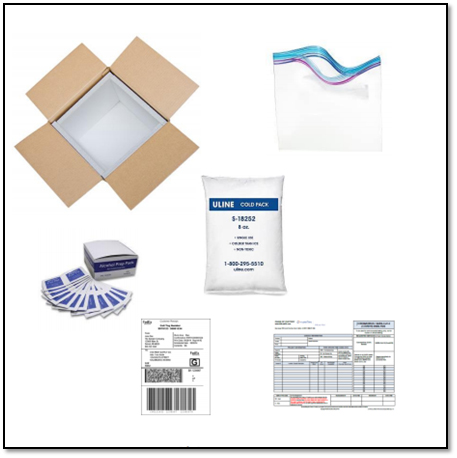
In addition, there are a few confounding factors that must be addressed before and after collecting the air samples. First the persona or area air sampling pump must be pre- and post-calibrated to a primary standard to validate the total air volume. Secondly, air samples must be placed in a sealable plastic bag, wiped down with an alcohol wipe to remove surface contamination, and shipped with cold packs overnight to the laboratory. A request and chain of custody form should accompany the shipment.
Concerns of RT-PCR Sample Results
The real time RT–PCR technique is highly sensitive and specific and can deliver a reliable diagnosis in as little as three hours, though some laboratories take on average between six and eight hours. Compared to other available virus isolation methods, real time RT–PCR is significantly faster and has a lower potential for contamination or errors, as the entire process can be carried out within a closed tube. It continues to be the most accurate method available for the detection of the COVID-19 virus.
Positive template and negative controls are used along with both internal and negative extraction controls to verify the test results. Until more robust interpretative measures are developed, the laboratories are only report qualitatively whether or not the RNA was detected in the air sample. While positive results are conclusive, a negative or indeterminate result may require resampling the work space.
Interpretation of Sample Results
Once the air sample is received by the lab, it is treated with several chemicals to remove proteins and fats, and extract only the RNA present in the sample. The RNA is reverse transcribed to DNA using a specific enzyme. Analysts add additional short fragments of DNA that are complementary to specific parts of the transcribed viral DNA. If the virus is present in a sample, these fragments attach themselves to target sections of the viral DNA. Some of the added genetic fragments are used for building DNA strands during amplification, while the others are used for building the DNA and adding marker labels to the strands, which are then used to detect the virus.
The mixture is then placed in an RT–PCR machine. The machine cycles through temperatures that heat and cool the mixture to trigger specific chemical reactions that create new, identical copies of the target sections of viral DNA. The cycle is repeated over and over to continue copying the target sections of viral DNA. Each cycle doubles the previous number: two copies become four, four copies become eight, and so on. A standard real time RT–PCR set-up usually goes through 35 cycles, which means that, by the end of the process, around 35 billion new copies of the sections of viral DNA are created from each strand of the virus present in the sample.
As new copies of the viral DNA sections are built, the marker labels attach to the DNA strands and then release a fluorescent dye, which is measured by the machine’s computer and presented in real time on the screen. The computer tracks the amount of fluorescence in the sample after each cycle. When a certain level of fluorescence is surpassed, this confirms that the virus is present. Scientists also monitor how many cycles it takes to reach this level in order to estimate the severity of the infection: the fewer the cycles, the more severe the viral infection is.
The real time RT–PCR technique is highly sensitive and specific and can deliver a reliable diagnosis in as little as three hours, though laboratories take on average between six and eight hours. Compared to other available virus isolation methods, real time RT–PCR is significantly faster and has a lower potential for contamination or errors, as the entire process can be carried out within a closed tube.
SARS-CoV-2 (COVID-19) results are being reported in either ‘Detected’ or ‘Non-Detected’ for two indicators of the SARS-CoV-2, per sample, as directed by the CDC. Indicator one is 2019-nCoV_N1 and indicator two is 2019-nCoV_N2. Both indicators detect the nucleocapsid protein ‘N’ gene of the SARS-CoV-2 coronavirus.
Conclusions and Recommendations
Industrial hygiene air monitoring is limited in scope to hospitals and other healthcare settings. Studies suggest that airborne transmission of SARS CoV-2 virus is likely. Aerosol dispersion models provide some information for commercial and residential structures but don’t consider larger more diverse industrial work environments or nontraditional work settings where there are confounding variables such as building ventilation, work load, duration and frequency exposure, and occupancy density.
While the infectious dose is unknown based on the evidence of Ro and K factors, the spread is high but the infectivity may be low. Other studies have shown that 18 to 3,200 log copies of the virus per cubic meter of air may be present in the built environment. This based on theory that a worker breathes on average 180 viral particles per hour with mechanical ventilation. With a higher occupancy density in an interior space, this could lead to a greater risk of airborne transmission and spread throughout the workplace.
Overall, test results have been limited due to the primary focus being on high touch environmental surface contamination. SARS-CoV 2 was present in some air samples that were collected from patient’s room. The MD8 Airscan® sampler and other test methods showed suitable performance for sampling SARS viruses. PTFE membrane and gelatin filters have demonstrated a high performance for the sampling of the viral loads in air. RT-PCR has been commonly used by analytical laboratories for the detection of SARS-CoV-2 in air samples.
In conclusion, air samples should only be collected when industrial hygiene professionals observe poor working conditions, adverse work environment or reported outbreaks of illness from the facility and air dispersion models cannot provide the answer. It should not be performed routinely for a risk assessment since the results cannot be quantified or related to an established national consensus standard or regulation. Air sampling should be used as a tool to evaluate workplace risk assessment and management strategies to mitigate exposure.
References:
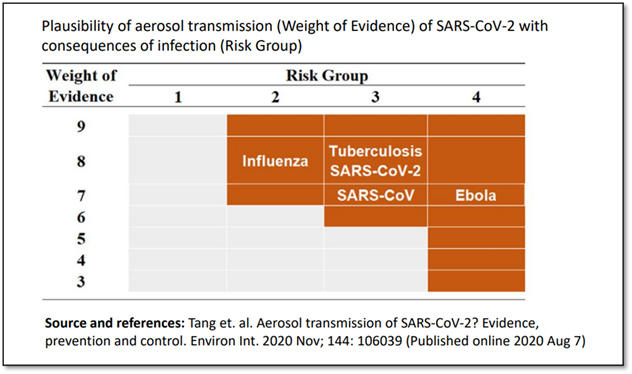
- Tang et. al. Aerosol transmission of SARS-CoV-2? Evidence, prevention and control. Environ Int. 2020 Nov; 144: 106039 (Published online 2020 Aug 7)
- Cox J, Mbareche H, Lindsley WG, Duchaine C. Field sampling of indoor bioaerosols. Aerosol Sci Technol. 2020;54(5):572-584. doi: 10.1080/02786826.2019.1688759. Epub 2019 Nov 21. PMID: 31777412; PMCID: PMC6880939.
- Lammers MJW, Lea J, Westerberg BD. Guidance for otolaryngology health care workers performing aerosol generating medical procedures during the COVID-19 pandemic. J Otolaryngology Head Neck Surg. 2020 Jun 3;49(1):36. doi: 10.1186/s40463-020-00429-2. PMID: 32493489; PMCID: PMC7269420.
- Cheng VC, Wong SC, Chan VW, So SY, Chen JH, Yip CC, Chan KH, Chu H, Chung TW, Sridhar S, To KK, Chan JF, Hung IF, Ho PL, Yuen KY. Air and environmental sampling for SARS-CoV-2 around hospitalized patients with coronavirus disease 2019 (COVID-19), Infect Control Hosp Epidemiol, 2020 Jun 8;1-8.
- Faridi S, Niazi S, Sadeghi K, Naddafi K, Yavarian J, Shamsipour M, Jandaghi NZS, Sadeghniiat K, Nabizadeh R, Yunesian M, Momeniha F, Mokamel A, Hassanvand MS, MokhtariAzad T. A field indoor air measurement of SARS-CoV-2 in the patient rooms of the largest hospital in Iran. Sci Total Environ. 2020 Jul 10;725:138401. doi: 10.1016/j.scitotenv.2020.138401. Epub 2020 Apr 6. PMID: 32283308; PMCID: PMC7194859.
- Chia PY, Coleman KK, Tan YK, Ong SWX, Gum M, Lau SK, Lim XF, Lim AS, Sutjipto S, Lee PH, Son TT, Young BE, Milton DK, Gray GC, Schuster S, Barkham T, De PP, Vasoo S, Chan M, Ang BSP, Tan BH, Leo YS, Ng OT, Wong MSY, Marimuthu K; Singapore 2019 Novel Coronavirus Outbreak Research Team. Detection of air and surface contamination by SARS-CoV-2 in hospital rooms of infected patients. Nat Commun. 2020 May 29;11(1):2800. doi: 10.1038/s41467-020-16670-2. PMID: 32472043; PMCID: PMC7260225.
- Lednicky JA, Lauzardo M, Hugh Fan Z, Jutla A, Tilly TB, Gangwar M, Usmani M, Shankar SN, Mohamed K, Eiguren-Fernandez A, Stephenson CJ, Alam MM, Elbadry MA, Loeb JC, Subramaniam K, Waltzek TB, Cherabuddi K, Glenn Morris J Jr, Wu CY. Viable SARS-CoV-2 in the air of a hospital room with COVID-19 patients. Int J Infect Dis. 2020 Sep 16:S1201-9712(20)30739-6. doi: 10.1016/j.ijid.2020.09.025. Epub ahead of print. PMID: 32949774; PMCID: PMC7493737.
- Razzini K, Castrica M, Menchetti L, Maggi L, Negroni L, Orfeo NV, Pizzoccheri A, Stocco M, Muttini S, Balzaretti CM. SARS-CoV-2 RNA detection in the air and on surfaces in the COVID-19 ward of a hospital in Milan, Italy. Sci Total Environ. 2020 Nov 10;742:140540. doi: 10.1016/j.scitotenv.2020.140540. Epub 2020 Jun 26. PMID: 32619843; PMCID: PMC7319646.
- Imke,Shröder, American Chemical Society, Chemical Health and Safety,27(3): 160-169,
- CDC, (2020). Coronavirus (COVID-19). Frequently Asked Questions. Retrieved From: https://www.cdc.gov/coronavirus/2019-ncov/faq.html “Interim Laboratory Biosafety Guidelines for Handling and Processing Specimens Associated with Coronavirus Disease 2019 (COVID-19)”. Retrieved From: https://www.cdc.gov/coronavirus/2019-ncov/index.html
- van Doremalen, N. et al. Aerosol and surface stability of HCoV-19 (SARS-CoV-2) compared to SARS-CoV-1. The New England Journal of Medicine. DOI: 10.1056/NEJMc2004973 (2020).
- Booth, T.F. et al., “Detection of Airborne Severe Acute Respiratory Syndrome (SARS) Coronavirus and Environmental Contamination in SARS Outbreak Units,” J. Infectious Disease, 2005, May 1; 191(9), pp 1472-7, Retrieved From: https://www.ncbi.nlm.nih.gov/pmc/articles/PMC7202477/
- Verreault, D. et al., “Methods for Sampling of Airborne Viruses,” MMBR, 72 (3), Oct. 2008, pp 413-44, doi: 10.1128/MMBR.00002-08, Retrieved From: https://www.researchgate.net/publication/23238381_Methods_for_Sampling_of_Airborne_Viruses
- Kenarkoohi A, Noorimotlagh Z, Falahi S, Amarloei A, Mirzaee SA, Pakzad I, Bastani E. Hospital indoor air quality monitoring for the detection of SARS-CoV-2 (COVID-19) virus. Sci Total Environ. 2020 Jul 29;748:141324. doi: 10.1016/j.scitotenv.2020.141324. Epub ahead of print. PMID: 32805566; PMCID: PMC7387923.
- Günther T, Czech-Sioli M, Indenbirken D, Robitaille A, Tenhaken P, Exner M, Ottinger M, Fischer N, Grundhoff A, Brinkmann MM. SARS-CoV-2 outbreak investigation in a German meat processing plant. EMBO Mol Med. 2020 Oct 4:e202013296. doi: 10.15252/emmm.202013296. Epub ahead of print. PMID: 33012091.
- Mubareka, Samira (September 21, 2019). Influenza and other respiratory viruses, Evaluation of bioaerosol samplers for the detection and quantification of influenza virus from artificial aerosols and influenza virus–infected ferrets. Retrieved From: https://www.ncbi.nlm.nih.gov/pmc/articles/PMC6800310/
- Christian Bekking Lily Yip Nicolas Groulx Nathan Doggett Mairead Finn Samira Mubareka, Evaluation of bioaerosol samplers for the detection and quantification of influenza virus from artificial aerosols and influenza virus–infected ferrets First published: 21 September 2019 https://doi.org/10.1111/irv.12678
- Kim UJ, Lee SY, Lee JY, Lee A, Kim SE, Choi OJ, Lee JS, Kee SJ, Jang HC. Air and Environmental Contamination Caused by COVID-19 Patients: a Multi-Center Study. J Korean Med Sci. 2020 Sep 21;35(37):e332. doi: 10.3346/jkms.2020.35.e332. PMID: 32959546; PMCID: PMC7505729.
- Lane MA, Brownsword EA, Morgan JS, Babiker A, Vanairsdale SA, Lyon GM, Mehta AK, Ingersoll JM, Lindsley WG, Kraft CS. Bioaerosol sampling of a ventilated patient with COVID-19. Am J Infect Control. 2020 Aug 4:S0196-6553(20)30760-4. doi: 10.1016/j.ajic.2020.07.033. Epub ahead of print. PMID: 32763347; PMCID: PMC7402277.
- Li,T.,,Boy M., Xiaoquan, L.,,LefeiHanc P.,CaodJunji,J.D., Qian Z., Shiqing, W., Zhenling, W., Weijun P.,, Lin Y., Xinping Z.: Air and surface contamination by SARS-CoV-2 virus in a tertiary hospital in Wuhan, China International Journal of Infectious Diseases, Vol. 99, October 2020, Pages 3-7, International Journal of Infectious Diseases
- Rahmani AR, Leili M, Azarian G, Poormohammadi A. Sampling and detection of corona viruses in air: A mini review. Sci Total Environ. 2020 Oct 20;740:140207. doi: 10.1016/j.scitotenv.2020.140207. Epub 2020 Jun 15. PMID: 32554029; PMCID: PMC7295527.
- N. Sze To, C. Y. H. Chao, Review and comparison between the Wells–Riley and dose-response approaches to risk assessment of infectious respiratory diseases, Indoor Air 2010; 20: 2–16.
Share on Socials!
Perspectives: Gas Detection
Uncharted Waters: Navigating During a Pandemic
Covid-19: Audiology “in the Trenches”
Leaders in Industrial Hygiene
Council for Accreditation in Occupational Hearing Conservation (CAOHC)
Subscribe!
Sign up to receive our industry publications for FREE!